How well-balanced is the scoring system?
Looking at players' detailed positions.
Hi, I’m tecomah, I publish every two weeks a data analysis about a specific topic related to Sorare. I regularly see statements like “Buy center-backs instead of fullbacks” or “attacking midfielders have better scores than defensive midfielders”. Let’s have a check.
If you like this article, please help up gain visibility. And if you’ve not joined Sorare yet, feel free to register using my link.
Methodology
There are only 4 positions in Sorare, and this is far from the complex reality on the pitch.
Instead, I mapped Sorare Cards with the detailed position of each player, obtained from Transfermarkt.
Defender → Center-Back, Full-Back
Midfielders → Defensive Mid, Centre Mid, Side Mid, Attacking Mid
Forward → Striker, Wingers, Deep Lying Forward
I collected Sorare Scores of each player between GW195 and GW229, which represents 60k data points.
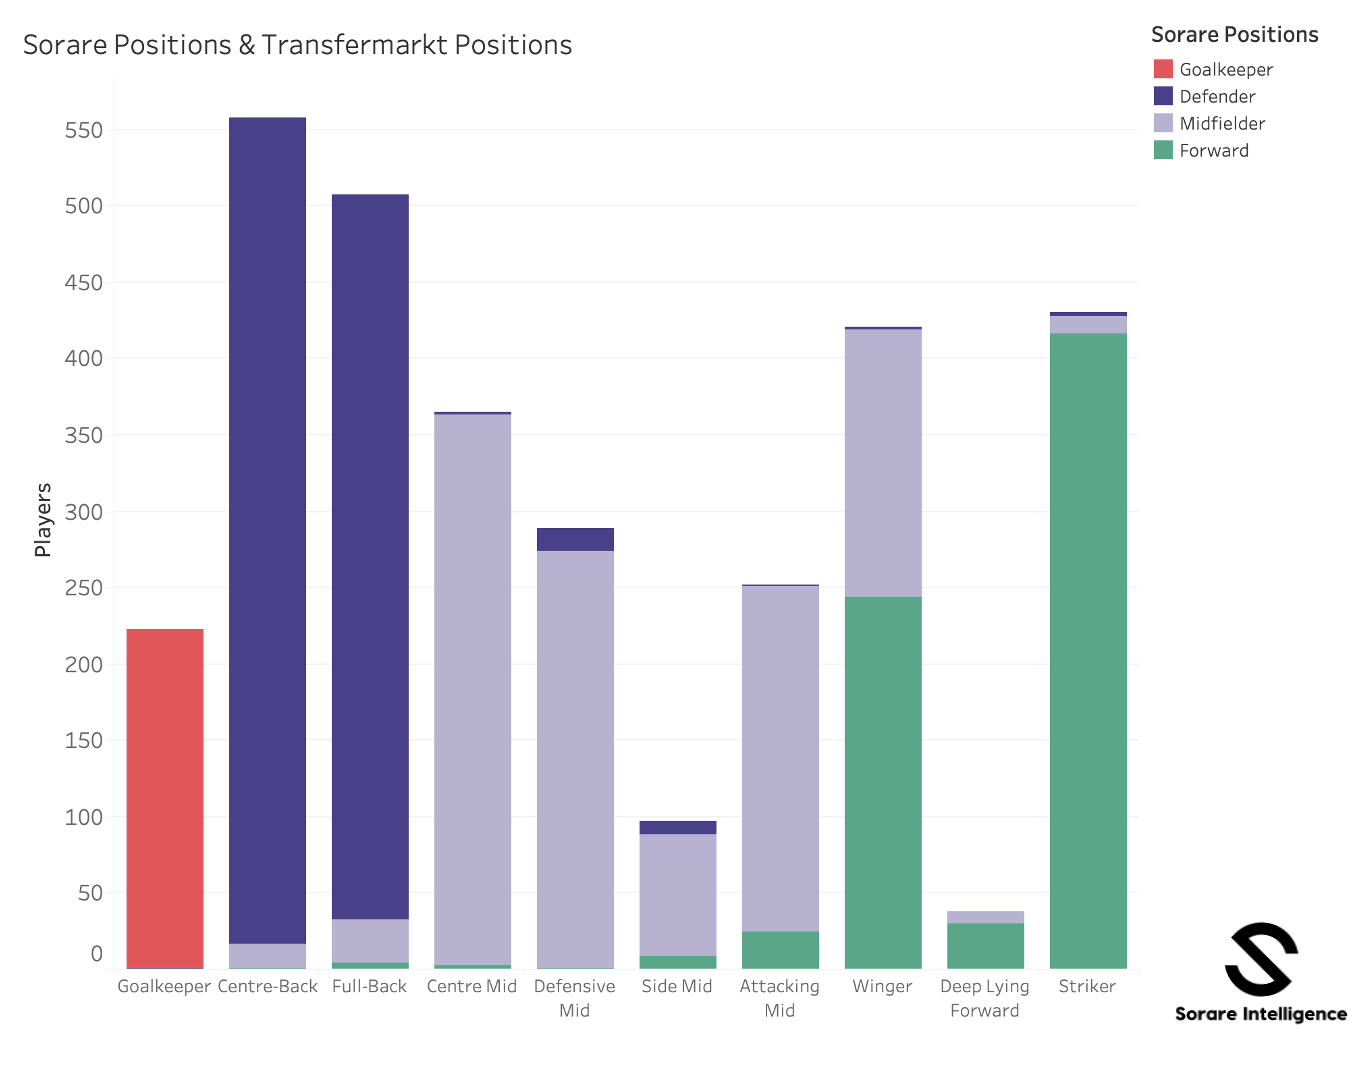
There is about 90% accurate matching between Sorare Positions and Transfermarkt Positions.
However, we observe that Wingers are split between Forwards and Midfielders in Sorare positions.
How the current scoring system is designed
The last big iteration on the scoring system was made in August 2020. A detailed article A new and improved scoring for Sorare was published by the team, which explained the main principles.
Screenshot from the 2020 article:
The idea was to calibrate the scoring so as to obtain a similar scoring distribution for each position. In particular, it was designed so scores average equals 40 points. Standard Deviation, which represents the average dispersion from the mean was quite similar for each position.
16 months later …
Sorare onboarded many new clubs
Expanded its coverage to new leagues
And to international fixtures
The distribution has significantly changed.
Overall, the mean increased by about 5 points for each position.
The median did not increase that much, which means that there is a higher dispersion than one year ago. This is confirmed by the higher standard deviation.
There are many possible factors that could explain these changes:
The introduction of new leagues with high-scoring teams (Ajax, FC Salzburg)
The introduction of international fixtures, with high-scoring teams
And also different data samples:
We’ve used a large data sample of games from players with more than 60 minutes spent on the pitch from the top 20 leagues in the world with an over-representation from the top 5 football leagues in the world. 45,295 player game statistics analysed
While I did not restrict the analysis to players with 60+ minutes played and did not over-represented the top 5 football leagues. I also had 59,182 player game statistics analyzed.
Is the scoring well-balanced across the different detailed positions?
There is a big imbalance between centre-backs and full-backs, which many of us already intuited. Full-backs have a lower average scoring (-6 pts) with the same standard deviation.
Defensive Midfielders And Attacking Midfielders have the same average scoring, but a very different standard deviation. You may think about it when building your teams: Defensive Midfielders may be ideal for threshold teams (when you need to reach a certain number of teams). Instead, attacking midfielders will be better to reach the highest rewards, as they will be more often decisive.
Side Midfielders are the big losers of the current scoring system, with the lowest average scoring (40.85).
Wingers are better scorers than strikers, by 1 point, with a similar standard deviation.
How to read it:
from the vertical axis: 50% of full-back scores are below 40, while 50% of centre-back scores are below 47
from the horizontal axis: 75% of striker scores are below 60, while 78% of winger scores are below 60.
How is it balanced across leagues?
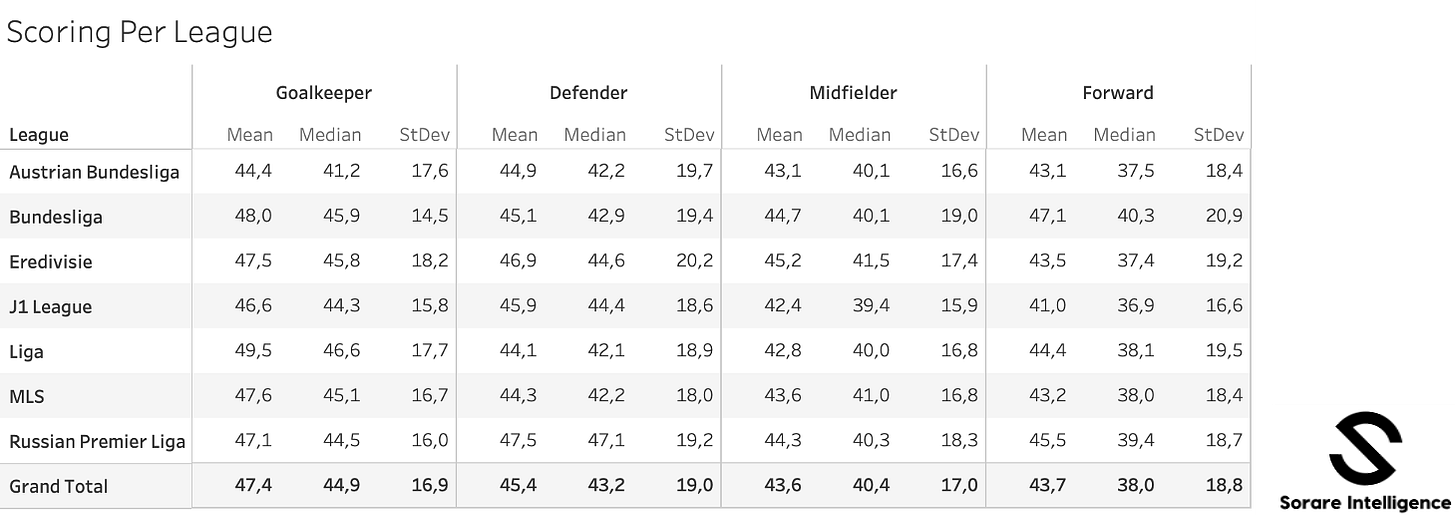
To eliminate some biases, we only look at leagues that are fully covered by Sorare: Austrian Bundesliga, Bundesliga, Eredivisie, J1 League, Liga, MLS, Russian Premier Liga.
We removed K-League from the analysis due to the complex matching, and Super Lig due to its freshness.
Overall it’s quite well-balanced, but this table drives a few insights:
Goalkeepers from the Austrian Bundesliga have the lowest average (44.4 vs 47.4 avg), which is not surprising because it’s one of the leagues with the highest numbers of goals per game.
Midfielders from Eredivisie have the best scores (45.2), but the forwards are below the average (43.5).
Forwards from the Bundesliga (47.1) are way above the average (43.7)
Bonus: 33 is the peak age
We like the veterans on Sorare.
Conclusion
I wanted to assess with data some beliefs, that I shared. And indeed, if the scoring per Sorare positions is still quite well balanced, it is not when we look at detailed positions. Also, there are strong signals of a growing scoring dispersion among players.
I think these are many elements that should be re-balanced, to better reflect the reality, but also in the case of S11 tournaments one day.
Let me know if it’s a topic you’re interested in. I could have gone deeper in the analysis by looking at the detailed scoring, but I wanted to make this high-level analysis first.
Again, many thanks to Sorare Data for making this data easily available.
If you liked this article, please help us spread the word on Twitter.


Great analysis, great article!
There is one point, however, i would diagree. Sorare (So5) is a game and it should not reflect reality. Other fantasy games like FPL or Draftkings use a very simplified scoring matrix to push the StDev of results as high as possible. The more 'real' a scoring becomes, the lower the range of outcomes (some players just play very well each game), which is very bad for a game that relies on randomness to work well.
The gap in the mean of centrebacks and fullbacks might be a little bit too high, but other than that i hope Sorare will be very cautious for any changes. From the perpective of game theory, it's not even necessary to change a thing, because any flaw in the matrix is getting balanced by the market.
Thanks a lot, very useful